1 minute read.Putting content in context
You can’t go far on this blog without reading about the importance of registering rich metadata. Over the past year we’ve been encouraging all of our members to review the metadata they are sending us and find out which gaps need filling by looking at their Participation Report.
The metadata elements that are tracked in Participation Reports are mostly beyond the standard bibliographic information that is used to identify a work. They are important because they provide context: they tell the reader how the research was funded, what license it’s published under, and more about its authors via links to their ORCID profiles. And while this metadata is all available through our APIs, we also display much of it to readers through our Crossmark service.
Crossmark is also about providing context. It is a button placed on content, which when clicked on brings up a pop-up box that tells the reader about significant updates such as corrections and retractions, together with other information about the publishing and editorial processes that have been applied to the content ahead of publication.
The Crossmark box can display information about authors, funders and licenses. In addition, our members can add “More information” and often do in the form of publication history, links to supporting materials, and peer review information. All of this supporting information helps the reader assess how well the content has been - and continues to be - curated by the publisher.
Who’s in?
250 Crossref members have signed up to use Crossmark (it’s an add-on service with its own fees). Though optional, some star pupils have even added Crossmark to their backfile content and as a result have Crossmark coverage on 99% of their content (kudos to PLOS, Rockefeller University Press and the societies represented by KAMJE, to name a few).
At the other extreme, some have applied Crossmark to less than 10% - these tend to be members with backfile content going back many decades, who are just implementing Crossmark for their more recent research outputs. Crossmark coverage is one of the things tracked in Participation Reports - pop over and take a look if you want to see what your organization is doing.
So what additional metadata has been registered by members using Crossmark? (data snapshot from our REST API April 2019):
- 8,711,500 content items have some Crossmark metadata
- 104,650 updates to content have been registered. Of these
- 55,000 are corrections and 28,000 errata
- 16,000 are new versions or new editions
- 2,700 are retractions and 1,280 are withdrawals
- 4,830,510 content items have some custom metadata, which appears in the More Information section of the Crossmark box. The most common metadata provided here is publication history, followed by copyright statements, the peer review method used, and whether the item has been checked for originality using Similarity Check.
Some news on clicks and views
We’ve been collecting usage statistics more or less since the Crossmark service launched in 2012, but have lacked a suitable way to share them. This will change later this year! In preparation, I’ve been digging around in the data and uncovered some interesting things.
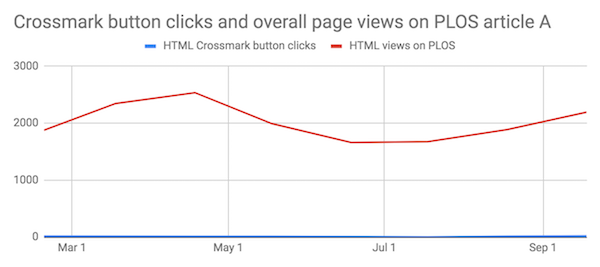
I was able to do a degree of comparison between Crossmark usage against overall article views using PLOS articles as they make their usage data openly available. I spot-checked fifteen articles and found that most of them had a monthly number of clicks on the Crossmark button in the low-twenties, regardless of the number of total page views the article had received.
The highly viewed paper above shows relatively very few clicks on the Crossmark button, whereas on the paper with fewer views, below, clicks on the button follow the overall pattern of usage.
It’s not unreasonable to suppose that a paper with very high usage has a higher proportion of lay readers visiting it, whereas a more niche paper is being visited by those with a research interest. This is encouraging, as it suggests researchers are interested in checking the status of the content and the additional “trust signals” that the Crossmark box can provide.
Web pages vs PDFs
We track the number of clicks on the Crossmark button in PDFs separately to those that come from web pages. (There are some that we can’t determine, usually because the link behind the button has been incorrectly formatted, but for most members these are minimal.)
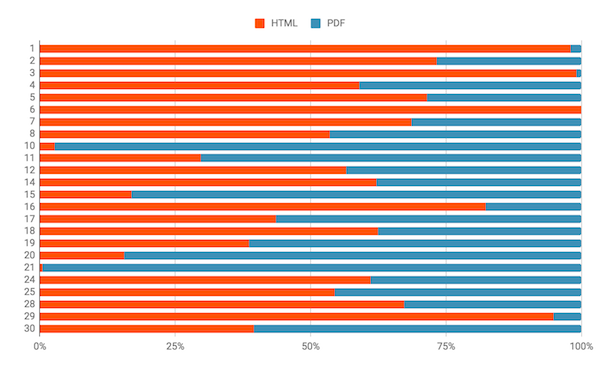
I looked at the 30 members with most Crossmark coverage, and averaged the number of clicks over a six month period in 2018. For two thirds of these members, clicks on the Crossmark button on their web pages exceed those in their PDFs, but there are also definite outliers.
Some are easily explained: member #6 hasn’t put the Crossmark button in any of their PDFs, while member #21 has only put it in their PDFs. Member 10 has the button on its article landing pages hidden in a “more information” section that the reader has to click to expand.
That said, member #20 has the button displayed prominently next to the article title but gets 85% of Crossmark clicks from PDFs. There’s no obvious subject bias - four of the members above are physics publishers - two have many more PDF clicks, two have more HTML.
None of the findings above contain nearly enough data to draw any definitive conclusions, but I hope they pique your interest to find out more when we make Crossmark usage statistics available to all members later this year. In the meantime if you have any suggestions/questions, or would be interested in helping us when we come to testing the statistics interface, please let me know.


